In today’s fast-paced business environment, effective financial management is crucial for success. Organizations are constantly seeking ways to enhance their decision-making processes and streamline their financial oversight. One of the most effective tools for achieving these aims is the financial dashboard tool. This comprehensive article delves into the world of financial dashboard tools, exploring their functionality, benefits, and best practices for implementation, while providing actionable insights for organizations looking to improve their financial strategies.
Understanding the Financial Dashboard Tool
What is a Financial Dashboard Tool?
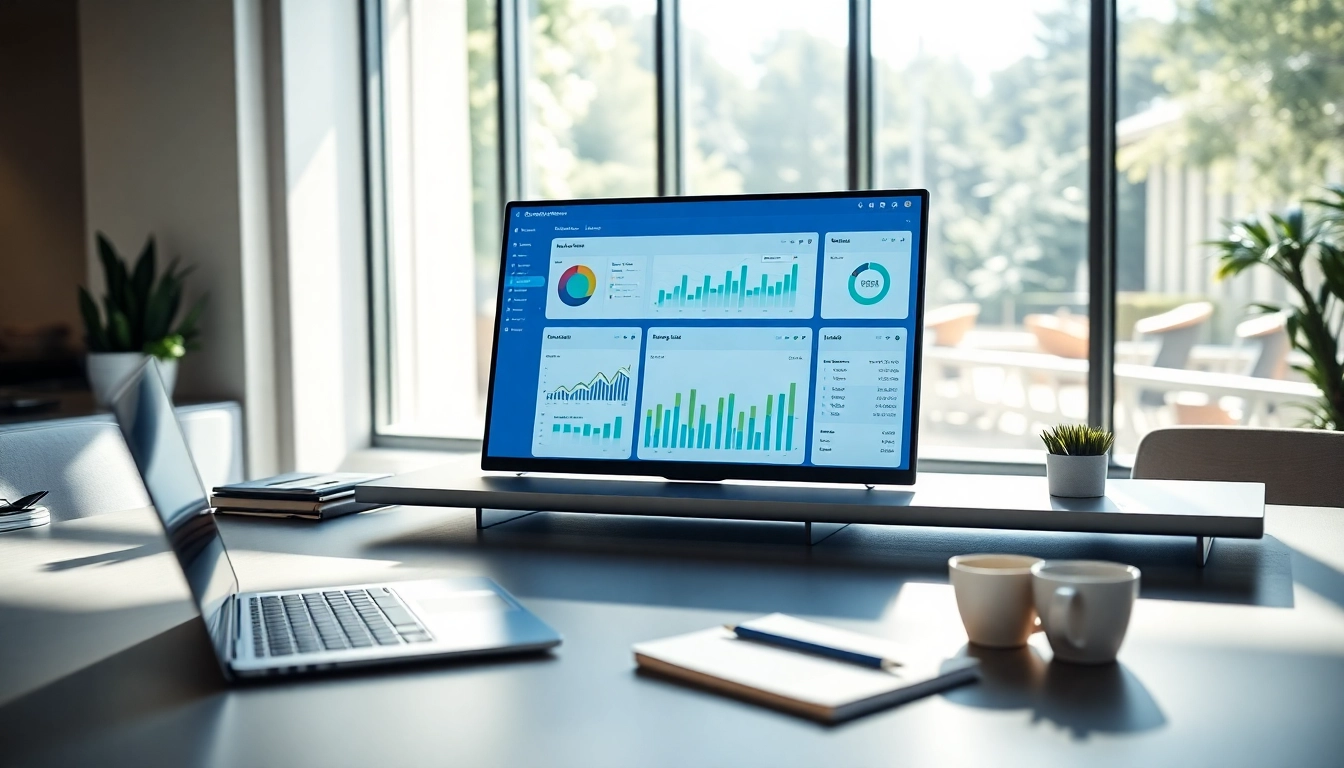
A financial dashboard tool is an interactive platform designed to give organizations an overview of their financial health and performance through visually appealing metrics, graphs, and key performance indicators (KPIs). By consolidating data from different sources—such as accounting software, CRM systems, and spreadsheets—this tool enables decision-makers to access real-time information, analyze trends, and monitor financial performance efficiently. The central goal of a financial dashboard tool is to streamline the collection and analysis of financial data, making it easier for users to make informed decisions based on current data.
Key Features of Financial Dashboard Tools
Several core features make financial dashboard tools effective for organizations:
- Data Visualization: These tools utilize charts, graphs, and infographics to present complex financial data in an easily digestible format.
- Real-time Data Integration: They pull data from various sources, ensuring that information is up-to-date and accurate, allowing for timely decision-making.
- Customizable Dashboards: Users can tailor their dashboards to reflect their unique preferences and requirements, enhancing usability and relevance.
- Reporting and Analytics: Financial dashboard tools often include built-in reporting features that automate the generation of financial reports, delivering insights on trends and anomalies.
- Collaboration Features: Many tools promote collaboration by allowing multiple users to access and share information, fostering a communal approach to financial management.
Benefits of Using a Financial Dashboard Tool
Implementing a financial dashboard tool offers numerous benefits for organizations:
- Improved Decision-Making: By providing quick access to critical financial metrics, organizations can make more informed decisions, seizing opportunities and mitigating risks effectively.
- Increased Efficiency: Automating data collection and reporting reduces manual workload, enabling teams to focus on analysis rather than data gathering.
- Enhanced Financial Visibility: A comprehensive view of financial performance allows organizations to identify trends, optimize spending, and allocation of resources, leading to improved financial health.
- Goal Tracking: Financial dashboard tools help track progress against financial goals and KPIs, ensuring everyone remains focused on achieving business objectives.
- Forecasting Capabilities: With analytical tools and historical data, organizations can create forecasts, anticipating future financial challenges and opportunities.
Implementing a Financial Dashboard Tool in Your Organization
Steps to Choose the Right Financial Dashboard Tool
Selecting the right financial dashboard tool involves meticulous evaluation of various options based on your organization’s specific needs:
- Identify Objectives: Clearly define what you want to achieve with a financial dashboard tool. These objectives could include enhancing reporting capabilities, improving data visualization, or enabling real-time analysis.
- Assess Integration Needs: Evaluate how the tool integrates with existing systems, including accounting software, ERP systems, and CRMs. Seamless integration is crucial for obtaining accurate real-time data.
- Usability: Choose a tool with an intuitive interface that your team can navigate easily. A steep learning curve can hinder effective adoption.
- Customization Options: Ensure the tool allows for customization to cater to your unique financial metrics and KPIs.
- Cost Consideration: Analyze the pricing structure. Consider factors like subscription costs, deployment fees, and potential hidden charges.
Setting Up Your Financial Dashboard Tool for Optimal Use
Once you have selected a financial dashboard tool, the setup process is essential for maximizing its effectiveness. Here are some best practices:
- Establish Clear Data Sources: Identify the data sources necessary for a complete financial overview. Ensure that these sources are accurately linked to the dashboard tool.
- Define KPIs: Choose and define the key performance indicators that need to be monitored closely, aligning them with organizational goals.
- Customize the Interface: Tailor the dashboard layout, colors, and visuals according to user roles and preferences to enhance engagement and usability.
- Implement Data Security Measures: Include security protocols, especially if sensitive financial data is being handled, ensuring compliance with regulations.
- Provide Access Levels: Set user permissions to regulate access to different data and features based on roles and responsibilities within the organization.
Integrating the Financial Dashboard Tool with Existing Systems
Integrating your financial dashboard tool with existing systems is key to leveraging its full potential:
- Collaborate with IT Teams: Work closely with your IT department for technical integration of the dashboard tool with existing systems, addressing any challenges that may arise.
- Execute Data Migration: Migrate existing financial data into the new system, ensuring accuracy during the transition to maintain data integrity.
- Workflows and Processes: Establish workflows that integrate the dashboard tool into daily financial operations, increasing visibility and improving responsiveness.
- Continuously Monitor Integration: Consistently evaluate how the integration is performing and make adjustments as necessary to optimize workflows.
Best Practices for Using a Financial Dashboard Tool
Customizing Your Financial Dashboard Tool for Your Needs
Customization enhances the user experience and ensures that relevant information is presented. Following these guidelines can help:
- Personalized Views: Allow users to create tailored views that display the metrics most pertinent to their roles, increasing engagement.
- Periodic Review: Conduct regular evaluations of dashboard configurations, making adjustments based on changing business needs or feedback from users.
- Utilize Templates: Leverage built-in templates to speed up the customization process while still retaining the flexibility needed for unique reporting requirements.
- Feedback Mechanism: Implement a feedback system where users can suggest improvements or new features, driving continuous enhancement.
Regularly Updating Data in Your Financial Dashboard Tool
Regularly updating data in your financial dashboard tool is vital for ensuring that decision-makers have access to the most current information:
- Automate Data Syncing: Enable automated syncing with relevant data sources to reduce the chances of human error and enhance efficiency.
- Schedule Updates: Establish a consistent schedule for updates, whether daily, weekly, or monthly, to align with reporting cycles and business rhythms.
- Data Quality Checks: Conduct routine checks to ensure data accuracy and integrity, making sure that users trust the information they are reviewing.
- Version Control: Keep track of changes and versions of data sets, allowing you to revert to previous datasets if discrepancies are discovered.
Training Staff on the Financial Dashboard Tool
Comprehensive training is crucial to achieve a high adoption rate within the organization. Key strategies include:
- Hands-On Training: Offer hands-on training sessions that allow users to explore the tool’s features and functionalities in a practical context.
- Resource Development: Create easy-to-understand resources including user manuals, quick guides, and video tutorials that employees can access anytime.
- Ongoing Support: Establish a support system that includes designated experts within the organization who can answer questions and provide assistance as needed.
- Feedback and Improvement: Gather feedback on the training process and continually refine training materials based on user experience to enhance learning.
Measuring Success with a Financial Dashboard Tool
Key Performance Indicators to Track with a Financial Dashboard Tool
A financial dashboard tool allows organizations to monitor a variety of key performance indicators that represent the organization’s financial health, including:
- Revenue Growth Rate: Tracks the increase in revenue over specific periods, reflecting business growth.
- Gross Profit Margin: Measures the financial health of the organization by assessing the difference between revenue and cost of goods sold.
- Operating Expenses Ratio: Compares operating expenses to total revenue, allowing monitoring of cost efficiency.
- Cash Flow Forecasts: Helps predict future cash flow based on current financial data, aiding in liquidity management.
- Sales Performance Metrics: Evaluate sales trends and profitability to identify successful products or services.
Utilizing Analytics from the Financial Dashboard Tool
The analytical capabilities of a financial dashboard tool can be leveraged to drive strategic planning:
- Trend Analysis: Examine historical data to identify trends, patterns, and cycles that inform future strategies.
- Define Benchmarks: Utilize analytics to set benchmarks for performance evaluation, aiding in the identification of best practices.
- Scenario Planning: Conduct scenario analyses to understand potential financial outcomes under different business conditions.
- Data-Driven Decisions: Use analytics to support decision-making processes, fostering an evidence-based culture within the organization.
Adjusting Strategies Based on Insights from Your Financial Dashboard Tool
Utilizing insights from the financial dashboard tool to adjust strategies is critical in maintaining a competitive edge:
- Respond to Market Changes: Be willing to pivot strategies based on emerging market trends or shifts in customer demand indicated by dashboard data.
- Strategic Resource Allocation: Use insights to reallocate resources towards high-performing areas that require investment for future growth.
- Performance Reviews: Regularly assess team performance against KPIs and adjust strategies that are underperforming.
- Long-Term Agility: Foster a culture of continuous improvement where data informs every strategic decision-making moment.
Future Trends in Financial Dashboard Tools
Emerging Technologies Influencing Financial Dashboard Tools
Financial dashboard tools are evolving with the advent of various emerging technologies:
- Artificial Intelligence: AI is pivotal in enhancing analytical capabilities, providing deeper insights and predictive forecasting based on vast datasets.
- Machine Learning: Machine learning algorithms can identify patterns and anomalies in financial data, empowering predictive analytics.
- Cloud Computing: Cloud technology facilitates easier access to financial dashboard tools from anywhere, supporting collaboration and data sharing across teams.
- Blockchain Technology: Blockchain can enhance data security and transparency, fostering trust in financial reporting.
User Experience Innovations in Financial Dashboard Tools
Innovations in user experience are transforming how financial dashboard tools operate:
- Responsive Design: Financial dashboards are increasingly designed for mobile and tablet access, allowing users to monitor finances on the go.
- Enhanced User Interfaces: User-friendly interfaces with interactive elements improve user engagement and facilitate data exploration.
- Gamification: Some tools employ gamification techniques to make data monitoring more engaging, encouraging user interaction and learning.
- Natural Language Processing: NLP capabilities allow users to query data using natural language, making it easier to access relevant information without extensive training.
Predictive Analytics and Financial Dashboard Tools
Predictive analytics is becoming increasingly relevant in the context of financial dashboard tools:
- Forecasting Trends: Utilizing historical data, organizations can forecast future financial trends and model different scenarios to guide decisions.
- Risk Management: Predictive analytics assists in identifying potential risks before they materialize, providing organizations with the opportunity to make proactive adjustments.
- Customer Behavior Insights: Analyzing customer purchase behavior allows financial dashboards to offer insights that pertain to revenue influences.
- Dynamic Predictive Models: Organizations are moving towards incorporating dynamic models that automatically adapt to new data inputs, maintaining accuracy and relevance.
In conclusion, the implementation and utilization of a financial dashboard tool can vastly improve an organization’s financial management and decision-making capabilities. By understanding the features and benefits, implementing best practices, and keeping a pulse on emerging trends, organizations can harness this powerful tool to optimize financial performance and drive growth.